- Published on
Chrome DevTools 101
- Author
- William Wittenbrock
When I first opened the DevTools, I didn't know what I was looking at, and I didn't realize how vital they were to web development. This is a letter to my younger self. Here's what I wish I had known when I first inspected an element.
I've written this tutorial to be interactive. Pop open the DevTools and follow along; like me, you probably learn better by doing. To open the developer tools, hold down option + command + i on Mac and control + shift + i on Windows.
Boom. We're hacking the mainframe now.
Understanding the Console
The Console panel does two things: displays error messages and runs JavaScript.

When you get a bug, the first thing you should do is check the Console. To learn more about an error, click the white link to the right of a message. Usually, the Console will point to the line where the interpreter has failed, making it easy to fix bugs. The Console panel also displays console.log() statements during run time, appearing in the order declared.
const addFive = number => number + 5;

addFive(5); // => 10
You're probably thinking, Hey, this is neat and all, but I'll never run JavaScript in the Console like this. Yeah, I agree. It's more convenient to run scripts in Node.js or a local environment. However, the Console is the best place to run Document Object Model APIs like document.querySelector() and document.getElementById(). Testing DOM APIs in the Console before adding them to my programs ensures that I target the exact elements I want. For example, let's say I want to create a script that turns all of a page's h2 tags the color orange.
// Assign all of the page's h2 tags to a variable
const subheadings = document.getElementsByTagName('h2');

// Convert the HTMLCollection to a JavaScript array,
// then loop through each h2 tag
[...subheadings].forEach(subheading => (subheading.style.color = 'orange'));
If you ran the above expressions in the Console, you'd notice that all of the page's h2 tags are orange now. Cool, it looks like our .getElementsByTagName() expression worked!
Understanding the Network panel
In addition to the Console, the second place to check when debugging is the Network panel. The Network panel's primary purpose is to display the resource requests a website makes; at a glance, you can see if a website has downloaded its scripts, images, fonts, and other resources. You can also inspect individual resource requests and view their HTTP headers, content, size, and other information.
When you first open the Network panel, it might be empty. Refresh the page with the Network panel open, and it will populate with requests.
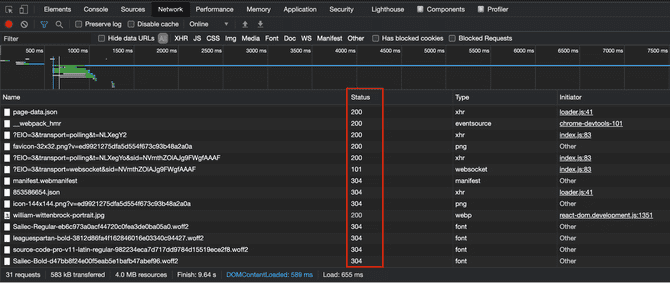
Each resource request has a corresponding HTTP response status code. Inside the Status column are a series of numbers ranging from 100 to 599. Each status code has a specific meaning. Here's a breakdown of the five types of status codes.
- Informational responses (100–199)
- Successful responses (200–299)
- Redirects (300–399)
- Client errors (400–499)
- Server errors (500–599)
400 and 500 status codes are the banes of a web developer's existence. A 400 error means that something went wrong with your client-side code. For example, your fetch() request may have a syntax error, your API key could be incorrect, or you might be hitting the wrong endpoint.
500 errors are harder to troubleshoot. 500 status codes can be a very general error, almost as vague as saying something like, "There's a problem." A 500 error means that there is a problem server-side. For example, it could be possible that the request's headers are incorrect, or there's a CORS issue or an error with the server endpoint. If you have control of the server, now is the time to open its error logs, get your Sherlock cap on, and try to detect what's wrong.
Understanding the Elements panel
Last but not least is the Element's panel. This panel displays the Document Object Model and each HTML element's corresponding CSS. If you need to debug or test CSS, this is where the magic happens.
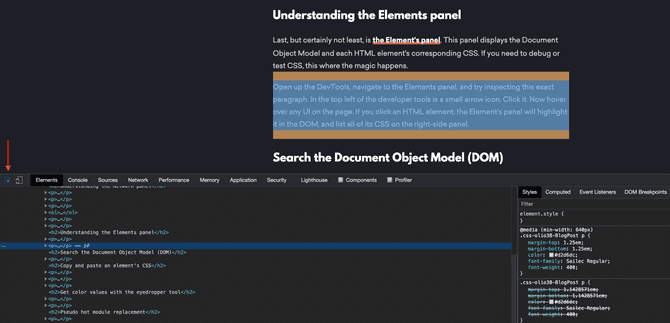
Open up the DevTools, navigate to the Elements panel, and try inspecting this paragraph. In the top left of the developer tools is a small arrow icon. Click it. Now hover over any user interface on this page. If you click an HTML element with the inspector arrow, the Element's panel will highlight it in the page and list all of its CSS styles on the right sidebar.
CSS's Specificity Hierarchy organizes the styles shown in the right sidebar. Styles at the top of the sidebar are the most specific; styles at the bottom are the least specific. The sidebar also shows styles the HTML element has inherited. If you're having problems getting a CSS style to stick (the HTML element seems to ignore your styles), take a look at this sidebar—your styles might be getting overwritten by one with higher specificity.
Simulate mobile and tablet devices
It's 2020—every user interface you engineer needs to be responsive; you've got to make them look good on the smallest iPhone and the largest 8K television. Luckily, it's easy to see what a website looks like with DevTool's Device Mode.
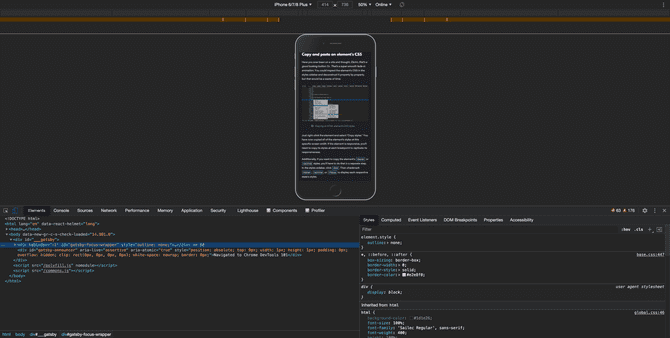
Switch to Device Mode by clicking the icon to the inspector arrow's right; you're now in Device Mode. Device Mode defaults to Responsive, where you can resize the page to any width or height. If you want to view the site from a specific device, click the drop-down in the browser's top center. Then select a device that you want to virtualize.
Device Mode is a great way to make sure your site looks good on every viewport, but it's not perfect. It's more of an estimate rather than a one-to-one replica. Experience has taught me that there's about a fifty to one-hundred-pixel deviation from DevTools to reality. So, if you're engineering a user interface that needs to look perfect at a particular viewport, you'll need to test it on the actual device, not with DevTools.
Search the Document Object Model (DOM)
If you want to search the page's DOM, open up the Elements tab and hold down command + f on Mac or control + f on Windows. These hotkeys will open a search bar where you can search the entire DOM. This is useful for finding specific CSS classes or understanding where a page is loading a specific <script>.
Copy and paste an element's CSS
Have you ever been on a site and thought, Damn, that's a good-looking button. Or That's a super smooth fade-in animation. I should add that to my site. You could inspect the element's CSS in the styles sidebar and type it out property by property, but that would be a waste of time.
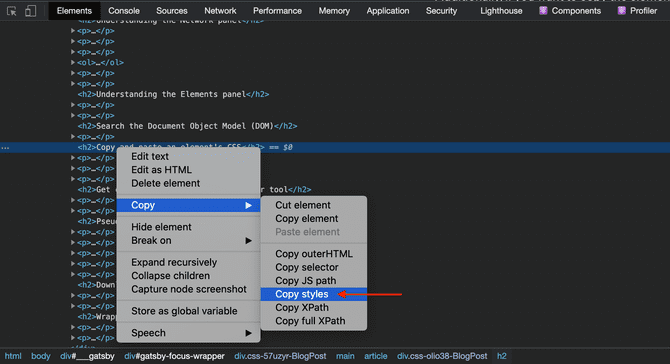
Just right-click the element and select "Copy styles." You have now copied all of the element's styles that apply to it at this screen width. If the element is responsive, you'll need to copy its styles at each breakpoint to replicate its responsiveness fully.
Additionally, if you want to copy the element's :hover or :active styles, you'll have to do that in a separate step. In the styles sidebar, click :hov. Then checkmark :hover, :active, or :focus to display each respective state's styles.
Inspecting and deconstructing beautiful CSS that you come across is a great way to improve your abilities; learn from the masters.
Get color values with the eyedropper tool
You can use the eyedropper tool to get the value of any color on a website. First, inspect an HTML element with a color property. If you inspect this paragraph, you'll notice that its color property is rgb(210, 214, 220).
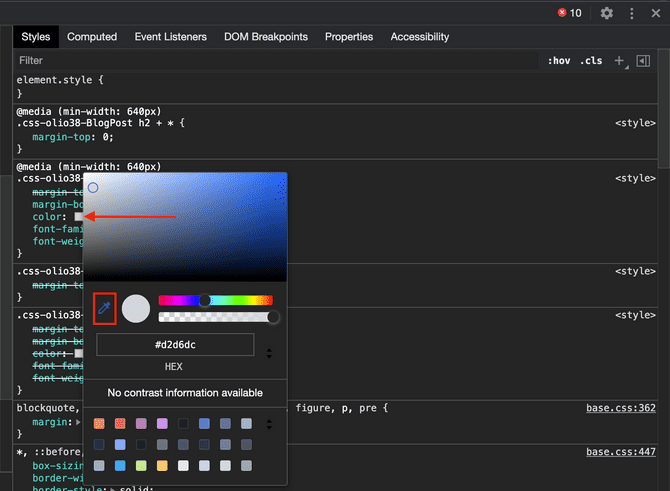
Here's the trick—click the color swatch adjacent to the RGB value; a color picker menu pops up. With the eyedropper tool active, you can select any element on the page to find its color value.
Pseudo hot module replacement
I've worked on projects without hot module replacement or LiveServer. Every time I made code changes on these projects, I had to clear the site's cache and refresh the browser. When building complex UI over several hours, this becomes a tiring ritual.
To get around this, I made my edits in the DevTools before adding them to my project's source code. You can edit the HTML of any website by right-clicking an element and selecting "Edit as HTML." Give it a try—change this section's title Pseudo hot module replacement from an h2 tag to an h3 tag.
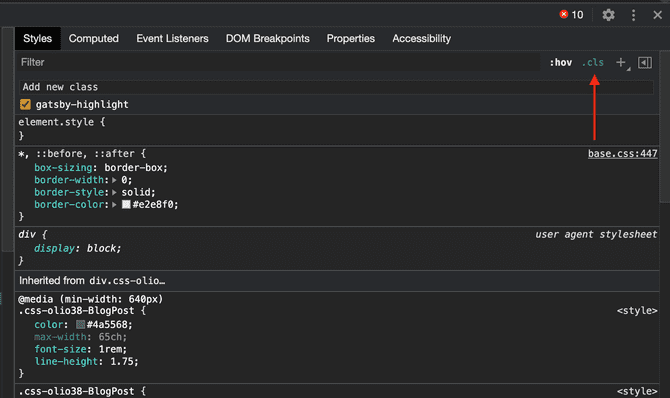
You can also add CSS classes to any element on a page. With an element selected, click the .cls button in the styles sidebar; it now displays all of the element's classes with corresponding checkboxes. In the "Add new class" input, type a CSS class to add to the element. Testing CSS classes like this pairs perfectly with Tailwind's utility system because it instantly shows how a CSS class styles an element.
Similarly, you can add inline styles to any element on the page. Within the element.style {} brackets, you can enter any CSS property and value pair. For example, try changing this paragraph's color and font-size.
One thing to note—the CSS you enter in the element.style {} brackets is inline CSS. Inline-styles have the highest specificity on the Specificity Hierarchy, overriding both IDs and classes. If you add the inline styles that you've tested in element.style {} into a CSS class, you might get unexpected results. The CSS class you just wrote has a lower specificity; pre-existing styles with a higher specificity might overwrite it. In short, styles you declare in element.style {} do not have the same specificity as styles in CSS classes.
Download a website's fonts
You can download any website's font files with the DevTools. Now I should say that you shouldn't use unlicensed fonts on published sites—that's stealing. However, it's a big bummer to buy a font for $60 only to realize it didn't look as great as you had hoped. I think it's ok to download a website's font files to try them out before paying.
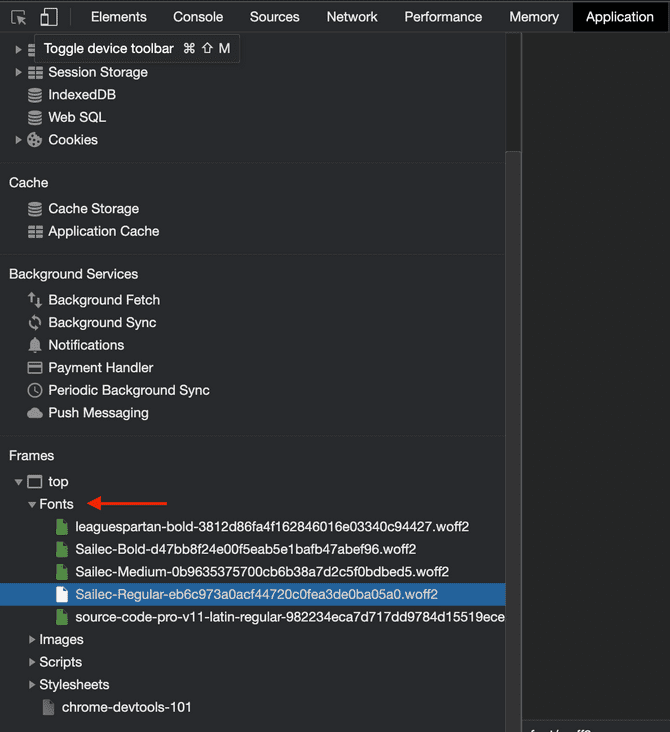
Open up the DevTools and click the Application panel. Scroll to the sidebar's bottom and expand the "top" menu located beneath the Frames heading. You'll see a list of folders, one of which is titled "Fonts." Expand the "Fonts" folder, and you'll be able to download any of the fonts by double-clicking it.
Wrapping up
The DevTools expand far beyond what I've gone over in this post. For starters, I didn't explain the Lighthouse or Performance panels. If this post has sparked curiosity beyond what I've covered, I recommend diving deeper and reading Google's official docs.
The next time you're on a favorite website, open the DevTools. Pop open the hood, inspect the engine, and get your hands greasy. Maybe you'll learn something.
